Quick answer
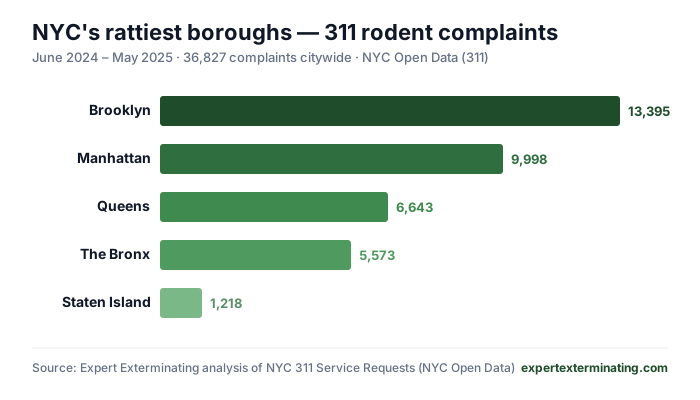
Based on 36,827 rodent complaints filed with NYC 311 between June 2024 and May 2025, Brooklyn is the rattiest borough (13,395 complaints, 36% of the city), followed by Manhattan. The single rattiest ZIP code is 10035 (East Harlem) with 2,025 complaints — more than double any other ZIP — with Ridgewood, Bushwick, Bed-Stuy and Flatbush rounding out the top five hotspots.
New York City logged 36,827 rodent complaints to its 311 service in the 12 months from June 2024 to May 2025. We mapped every one of them by borough and ZIP code, using the City’s own public data, to answer the question every New Yorker asks at some point: which neighborhoods have the most rats?
The rattiest borough: Brooklyn
Brooklyn isn’t just the most-populous borough — it’s the rattiest, generating more than a third of every rat complaint in the city.
| Rank | Borough | Rodent complaints | Share of NYC |
|---|---|---|---|
| 1 | Brooklyn | 13,395 | 36.4% |
| 2 | Manhattan | 9,998 | 27.1% |
| 3 | Queens | 6,643 | 18.0% |
| 4 | The Bronx | 5,573 | 15.1% |
| 5 | Staten Island | 1,218 | 3.3% |
The 20 rattiest ZIP codes in NYC
Zoom in and the picture sharpens. East Harlem (ZIP 10035) is the rattiest ZIP in the city by a wide margin — 2,025 complaints, more than double the runner-up. After that, the hotspots cluster in north-central Brooklyn (Bushwick, Bed-Stuy, Crown Heights), brownstone Brooklyn (Park Slope, Prospect Heights, Flatbush), and Upper Manhattan (Harlem, Hamilton Heights).
| Rank | Neighborhood | ZIP | Complaints |
|---|---|---|---|
| 1 | East Harlem (Manhattan) | 10035 | 2,025 |
| 2 | Ridgewood / Glendale (Queens) | 11385 | 907 |
| 3 | Bushwick / Bed-Stuy (Brooklyn) | 11221 | 799 |
| 4 | Bedford-Stuyvesant (Brooklyn) | 11216 | 722 |
| 5 | Flatbush / Prospect-Lefferts (Brooklyn) | 11226 | 721 |
| 6 | Prospect Heights / Clinton Hill (Brooklyn) | 11238 | 684 |
| 7 | Upper West Side / Morningside (Manhattan) | 10025 | 667 |
| 8 | Park Slope / Windsor Terrace (Brooklyn) | 11215 | 664 |
| 9 | Williamsburg (Brooklyn) | 11211 | 574 |
| 10 | Bed-Stuy / Ocean Hill (Brooklyn) | 11233 | 533 |
| 11 | Bushwick (Brooklyn) | 11237 | 517 |
| 12 | Highbridge / Concourse (Bronx) | 10452 | 513 |
| 13 | Norwood / Williamsbridge (Bronx) | 10467 | 507 |
| 14 | Kensington / Windsor Terrace (Brooklyn) | 11218 | 502 |
| 15 | Bushwick / East Williamsburg (Brooklyn) | 11206 | 502 |
| 16 | Crown Heights (Brooklyn) | 11213 | 488 |
| 17 | Harlem / Morningside (Manhattan) | 10027 | 483 |
| 18 | Sunset Park (Brooklyn) | 11220 | 462 |
| 19 | Central Harlem (Manhattan) | 10026 | 460 |
| 20 | Hamilton Heights (Manhattan) | 10031 | 442 |
Why these neighborhoods?
The hotspots aren’t random — they share a recipe rats love:
- Old, dense, connected housing. Pre-war apartment buildings and brownstones across Bed-Stuy, Park Slope, Flatbush and Harlem have shared walls, basements and aging plumbing that let rats move between units and buildings unseen.
- Food everywhere. Busy restaurant and retail corridors — 125th Street in East Harlem, Knickerbocker Avenue in Bushwick, Church Avenue in Flatbush — generate constant trash and food waste that feeds rat colonies into the surrounding residential blocks.
- Green space and waterfronts. Proximity to Prospect Park, Morningside Park and the Brooklyn waterfront adds outdoor harborage and seasonal pressure as rats move indoors when it cools.
- Aging infrastructure. NYC’s old sewer and subway network gives rats a citywide underground highway between blocks — which is why a single untreated building can re-seed a whole street.
Methodology & honest caveat
We pulled every record with a complaint type of Rodent from the NYC 311 Service Requests dataset (NYC Open Data) for June 1, 2024 – May 31, 2025, then aggregated by borough and by incident ZIP code. Data pulled June 10, 2026.
Important: this ranks neighborhoods by reported rat activity, not by absolute rat population — those aren’t the same thing. A 311 complaint count reflects both how many rats are around and how likely residents are to report them. Civically-engaged, higher-income or higher-density areas can rank higher partly because more people pick up the phone. Read this as a map of where New Yorkers are seeing and reporting rats — a strong, current signal, but a proxy. The City’s own Rodent Inspection program (DOHMH) and its Rat Mitigation Zones are the complementary, inspection-based view.
Use this data (free to cite, embed or download)
Journalists, researchers and bloggers are welcome to use this — it’s public data, openly presented. A link back is appreciated.
Download the full dataset (CSV): rattiest-nyc-rodent-complaints-2025.csv — boroughs + top-20 ZIPs.
Cite it as:
Expert Exterminating analysis of NYC 311 Service Requests (NYC Open Data), rodent complaints, June 2024–May 2025. https://expertexterminating.com/guides/rattiest-nyc-neighborhoods/
Embed the chart (copy-paste — it links back to the full data):
<a href="https://expertexterminating.com/guides/rattiest-nyc-neighborhoods/">
  <img src="https://expertexterminating.com/images/rattiest-nyc-boroughs-2025.svg"
       alt="NYC rodent complaints by borough, 2024–2025 — data by Expert Exterminating" width="700" style="max-width:100%;height:auto" />
</a>
Living in a hotspot? Here’s what works
If your block is on this list, the fix is exclusion, not just bait:
- Seal entry points. Rats get through a gap the size of a quarter — close holes around pipes, foundations, vents and doors. See our full guide on how to get rid of rats in NYC.
- Cut the food supply. Hard-sided trash containers, no overnight bags on the curb, clear clutter and overgrowth.
- Work the whole building or block. Because NYC rats travel underground, treating one apartment rarely holds. Coordinate with your building — and if you rent, know your landlord’s legal rat responsibilities.
- Get a professional inspection. A licensed exterminator finds the entry points and harborage you’ll miss, sets up safe tamper-resistant control, and proofs the property. Expert Exterminating provides rat and rodent control across all five boroughs.
Whether you’re in East Harlem, Bushwick, Flatbush or anywhere on this map, the rats won’t sort themselves out — but a proper exclusion-first program will.